Python开发
1.零拷贝
1.1基本原理
可以使用memoryview和bytearray实现零拷贝操作。
memoryview类型是让程序能够使用CPython的缓冲协议高效地操纵字节数据,这套协议属于底层的C API,允许Python运行时系统与C扩展访问底层的数据缓冲,而bytes等实例正是由这种数据缓冲对象所支持的。memoryview最大的优点是能够在不复制底层数据的前提下,制作出另一个memoryview。本质是对现有缓冲区(如bytes、bytearray、array.array等)的 “视图”,它不存储数据,仅记录对原始缓冲区的引用和访问范围。通过memoryview访问数据时,直接操作原始缓冲区的内存,完全避免数据复制,是典型的零拷贝实现。
bytearray类型本身是可变的字节序列,在内存中占据一块连续的缓冲区。当需要传递或处理其数据时,直接引用该缓冲区即可,无需复制(除非显式调用复制方法,如bytes(bytearray_obj))。其 “零拷贝” 体现在作为原始数据容器,允许直接修改和访问内存中的字节。
1.2应用场景
memoryview的核心优势是零拷贝访问缓冲区,适合需要高效访问大型数据的部分内容或在不同数据结构间共享数据的场景:
- 处理大型二进制数据:当数据量较大(如几 MB 甚至 GB 级)时,若只需访问其中部分内容(如切片),
memoryview可避免复制子序列。
示例(可直接复制到环境观察输出结果):
    data = b'shave abd a haircut , two bits'
    view = memoryview(data)
    chunk = view[12:19]
    print(chunk)
    print('Size:            ', chunk.nbytes)
    print('Data in view:    ', chunk.tobytes())
    print('Underlying data: ', chunk.obj)
bytearray的核心优势是可变的字节缓冲区,适合需要原地修改二进制数据的场景:
- 动态构建 / 修改二进制协议:在网络通信或文件处理中,若需要按协议格式逐步拼接、修改字节(如添加头部、修改校验位),
bytearray可直接在原地修改,避免频繁创建bytes副本(bytes不可变,修改需复制)。
示例:构建一个包含长度字段的自定义协议包
# 动态构建协议包:[长度(2字节)][数据(n字节)]
data = b"hello world"
pkg = bytearray(2 + len(data))  # 预分配缓冲区
pkg[0:2] = len(data).to_bytes(2, byteorder='big')  # 写入长度
pkg[2:] = data  # 写入数据(直接引用,无复制)
- I/O 操作的缓冲区:作为读写操作的中间缓冲区,尤其是需要重复使用缓冲区时(如循环读取网络数据),
bytearray可减少内存分配开销。
示例:用固定缓冲区读取文件
buffer = bytearray(1024)  # 固定大小的缓冲区
with open("large_file.bin", "rb") as f:
    while True:
        n = f.readinto(buffer)  # 直接读入buffer,无复制
        if n == 0:
            break
        process(buffer[:n])  # 处理读取的部分
- 需要修改的字节序列处理:如加密 / 解密、压缩 / 解压缩过程中,需对原始字节进行原地变换(如异或操作、替换特定字节),
bytearray的可变性使其无需复制即可完成。
使用bytearray和memoryview配合使用,能够实现更好效果的零拷贝读写, 具体可以参考《Effective Python》中第74条的流媒体视频相关demo
1.3与C++交互中的零拷贝应用
在python与C++交互过程中,通常会用到pybind11绑定C++接口,然后在python侧进行调用。
1.3.1 从python到C++的零拷贝
C++侧使用python传过来的py::buffer.request获取py::buffer_info,底层的指针和长度
std::string echo(py::buffer buf) {
    py::buffer_info info = buf.request();
    const char* data = static_cast<const char*>(info.ptr);
    return data;
}

PYBIND11_MODULE(zero_copy, m) {  m.def("echo", &echo);}
python侧调用:
import zero_copy
result = zero_copy.echo(b"hello")
print("echo result", result) # output: echo result hello
如果在C++侧需要修改python传过来的参数内容,需要在python侧传入bytearray,然后C++侧修改内容:
std::string echo(py::buffer buf) {
    py::buffer_info info = buf.request(true);
    char* data = static_cast<char*>(info.ptr);
    if (info.size > 0) {
        data[0] = 'Z';  // modify buf
        data[1] = 'Y';
    }
    return data;
}
result = zero_copy.echo(bytearray(b"hello"))
print("echo result", result)#output: echo result ZYllo
1.3.2 从C++到python的零拷贝
上述的例子中我们成功的实现了从python传递到c++的零拷贝,接下来看看如何实现从C++到python的零拷贝。这里用到了py::memview 的from_buffer或者from_memory方法,这两个方法提供了不归python管理的、C++侧的内存视图。
class caller {
public:
    caller(py::function func) : callback_(func) {}
    void hello(py::buffer buf) {
        py::buffer_info info = buf.request(true);
        char* data = static_cast<char*>(info.ptr);
        if (info.size > 0) {
            data[0] = 'Z';  // modify buf
            data[1] = 'Y';
        }
        str_ = "string from c++";
        auto view = py::memoryview::from_buffer(str_.data(), {str_.size()}, {sizeof(uint8_t)});
        py::gil_scoped_acquire acquire;
        callback_(view);
    }
private:
    py::function callback_;
    std::string str_;
};
PYBIND11_MODULE(zero_copy, m) {
    py::class_<caller>(m, "caller")
        .def(py::init<py::function>())
        .def("hello", &caller::hello);
}
python侧调用:
import zero_copy
def callback(mv):
    print(mv.tobytes()) #will print: string from c++
c = zero_copy.caller(callback)
c.hello(bytearray(b"hello"))
除了上述方法,还可以使用智能指针来让python管理字符串生命周期:
#include <pybind11/pybind11.h>
#include <string>
#include <memory>

namespace py = pybind11;
class string_holder {
public:
    string_holder(std::string val) : value(std::move(val)) {}
    py::object str_view() {
        auto view = py::memoryview::from_buffer(value.data(), {value.size()},{sizeof(uint8_t)});
        return view;
    }
private:
    std::string value;
};
class caller {
public:
    caller(py::function func) : callback_(func) {}
    std::shared_ptr<string_holder> hello(py::buffer buf) {
        py::buffer_info info = buf.request(true);
        char* data = static_cast<char*>(info.ptr);
        if (info.size > 0) {
            data[0] = 'Z';  // modify buf
            data[1] = 'Y';
        }
        // auto view = py::memoryview::from_buffer(str_.data(), {str_.size()}, {sizeof(uint8_t)});
        callback_(data);
        auto holder = std::make_shared<string_holder>("string from c++");
        return holder;
    } private:

    py::function callback_;
    std::string str_;
};

PYBIND11_MODULE(zero_copy, m) {
    py::class_<string_holder, std::shared_ptr<string_holder>>(m, "Holder")
        .def(py::init<std::string>())
        .def("str_view", &string_holder::str_view);
    py::class_<caller>(m, "caller")
        .def(py::init<py::function>())
        .def("hello", &caller::hello);
}
python侧调用:
import zero_copy
def callback(mv):
    print(mv) #will print: ZYllo
c = zero_copy.caller(callback)
r = c.hello(bytearray(b"hello"))
print(r.str_view().tobytes()) #will print: string from c++
2.优化gil锁
篇幅过长,单独写一篇
Python调试
1.使用pdb做交互调试
python有内置的交互式调试器(interactive debugger),可以检查程序状态,打印局部变量等。用来触发调试器的指令就是python内置的breakpoint函数,这个函数效果与先引入内置的pdb模块然后运行set_trace函数是一样的效果。
进入Pdb提示符界面之后可以使用help查看完成的命令列表。
另外调试器还支持一项有用的功能,叫做事后调试(post-mortem debugging),当我们发现程序异常崩溃后,想通过调试器查看抛出异常时的状态,但是有时不确认在哪里调用breakpoint函数,这种情况下就需要这项功能。
我们可以使用:
python3 -m pdb -c continue <program path>
这条命令是把有问题的程序放在pdb模块的控制下运行,其中-c的continue命令表示让pdb启动程序之后立刻向前推进,直到遇到断点或者异常终止。
2.使用tracemalloc来掌握内存使用和泄漏情况
在python 3.4之前的版本中,可以使用gc模块来统计内存的使用情况,gc模块会把垃圾回收器目前知道的每个对象都列出来,但这种方式存在一些缺点,这里不详细阐述。
在python 3.4版本推出一个新的内置模块tracemalloc,相比于gc模块更佳方便清晰。tracemalloc能够追溯对象到分配它的位置,因此我们可以在执行测试模块之前和之后分别给内存使用情况做快照,对比两份快照的区别。
import tracemalloc
if __name__ == "__main__":
    tracemalloc.start(10)
    t1 = tracemalloc.take_snapshot()
    # main()
    data = []
    for i in range(100):
        data.append(os.urandom(100))
    t2 = tracemalloc.take_snapshot()
    stats = t2.compare_to(t1, 'lineno')
    for stat in stats[:3]:
        print(stat)
输出:
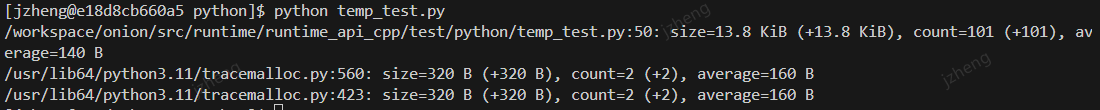
每一条记录都有size和count指标,用来表示这行代码分配对象占用了多少内存以及这些对象的数量,通过这两项指标我们可以很快发现占用内存比较多的对象是由那几行代码分配的。
tracemalloc还可以打印完整的站追踪信息,能够达到的帧数是根据tracemalloc.start函数设置的。
import tracemalloc
if __name__ == "__main__":
    tracemalloc.start(10)
    t1 = tracemalloc.take_snapshot()
    data = []
    for i in range(100):
        data.append(os.urandom(100))
    t2 = tracemalloc.take_snapshot()
    stats = t2.compare_to(t1, 'traceback')
    top = stats[0]
    print('biggest is:')
    print('\n'.join(top.traceback.format()))
输出:

这样的栈追踪信息很有用,可以帮助我们找到程序中累计分配内存最多的类和函数。
参考
《Effective Python》第二版
https://mp.weixin.qq.com/s/-VwMFsBy7AYHCsi3gJQBaQ
文档信息
- 本文作者:JianZheng
- 本文链接:https://zhengjian526.github.io/left-handed_knife//2025/08/12/Python-effective-way-to-better-python/
- 版权声明:自由转载-非商用-非衍生-保持署名(创意共享3.0许可证)